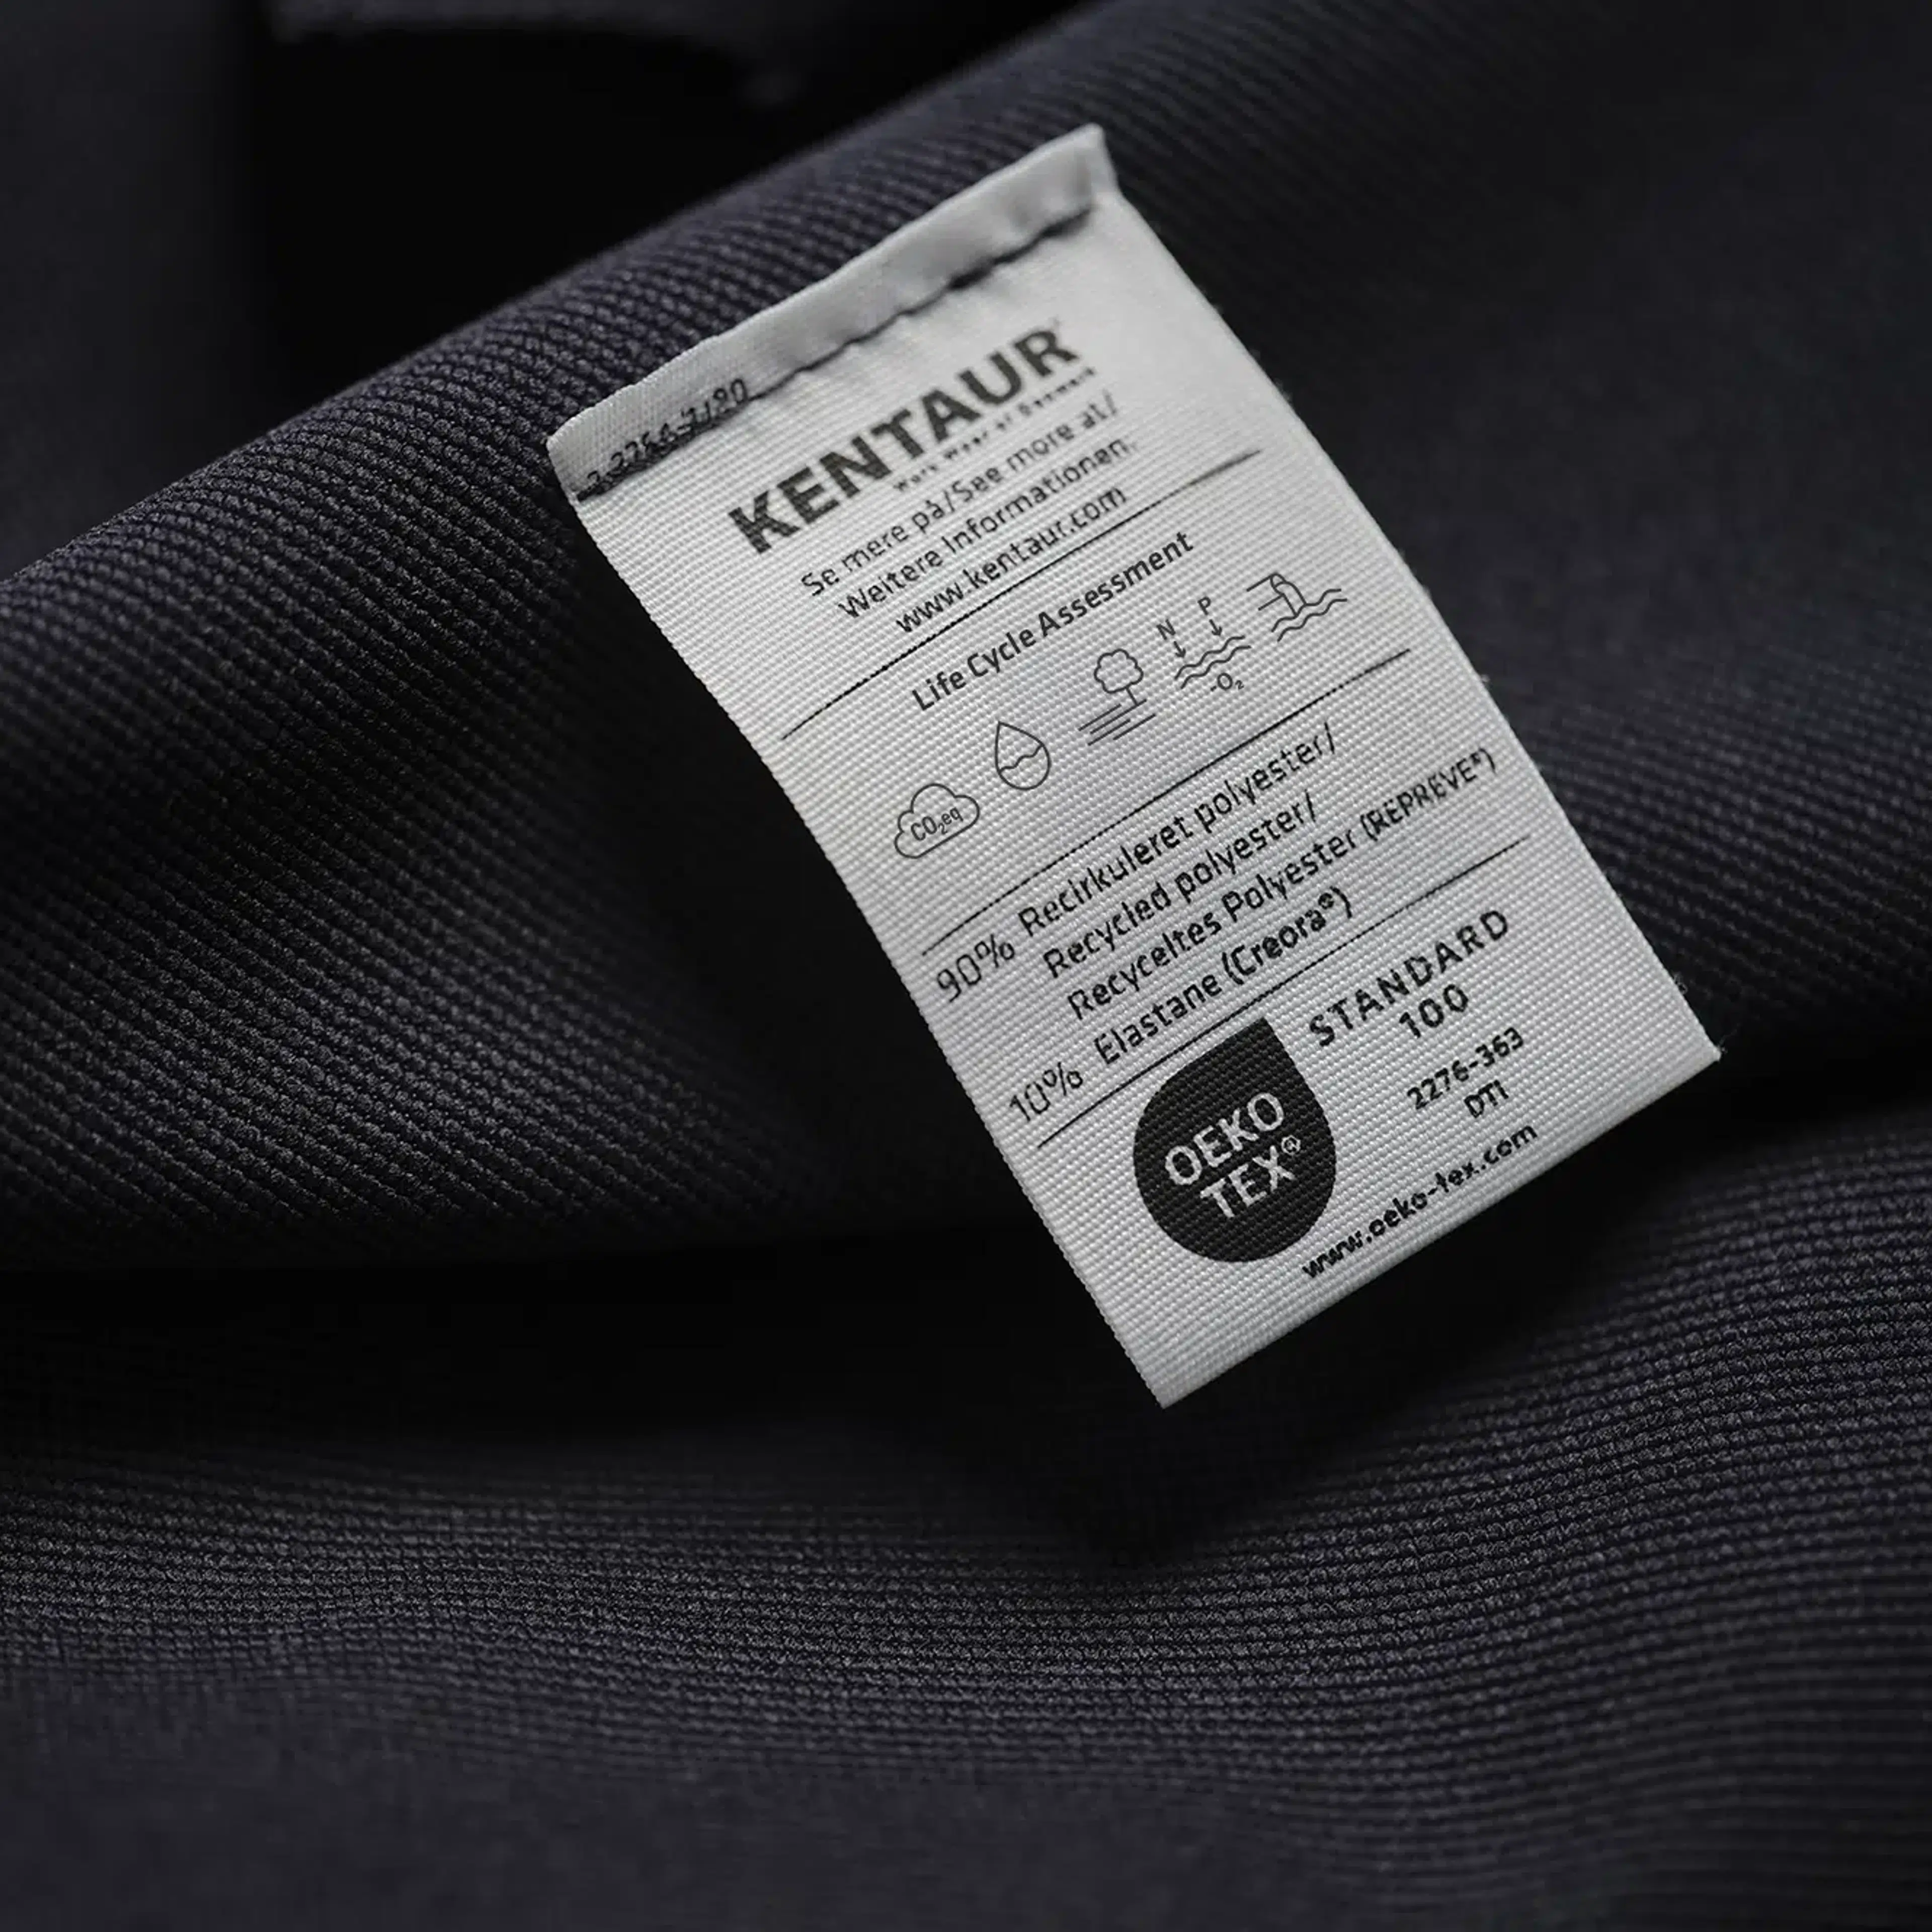
At Kentaur, we believe that every choice matters, especially when it comes to sustainability. That is why we created Our Choice – our responsibility strategy that guides how we work, from the materials we select to the way we produce.
A key part of Our Choice is Life Cycle Assessment (LCA), a tool that helps us measure the environmental impact of our products. By using LCA, we choose to be transparent about our environmental impact data, giving you the information you need to make choices that reflect your values.
However, LCA results can be complex and sometimes hard to interpret. While we can present the impact up to the point of distribution, the reality is that the “use phase” - the way the product is used and how long it lasts – plays a critical role in its overall environmental footprint.
The more a product is used, the less impact it has per use over its lifetime. For example, a product that may initially show a higher environmental impact during production could ultimately have a lower total footprint if it lasts longer than an alternative product with a lower initial impact.
This means that, from a broader life cycle perspective, longevity and frequency of use are key factors. A product with a seemingly higher footprint at the outset may perform better environmentally in the long run due to its durability and extended use. This complexity is essential to understand when evaluating sustainability, as focusing solely on raw material or production phases can overlook the complete picture of a product’s environmental performance.
But we understand that an effective way to assess how different products affect the environment is by measuring their impact and comparing key environmental indicators – such as greenhouse gas emissions, water use and land use. Without these measurements, it is impossible to make informed decisions and drive meaningful, positive change.
How we measure the environmental footprint of our products
We have partnered with Made2Flow to help us calculate the impact of our products, from raw materials to the delivery of our workwear to customers. By examining real world data from our supply chain, supplemented with similar verified data from textile supply chains, Made2Flow calculates the impact of each product across all steps of our supply chain.
They follow the global ISO 14040 standard and the European Commission’s PEFCR guidelines. Their work helps keep us accountable by ensuring we share accurate and up-to-date information with you.
The data we share with you consists of both primary and secondary data. Primary data makes up about 20% of our total data foundation and is gathered directly from our own supply chain. The rest is validated secondary data, based on previously collected primary data selected for its relevance and representativeness within our supply chain.
Our chosen environmental impact indicators
We have selected the environmental impact indicators most relevant to the textile industry, focusing on the areas where we have the largest footprint. Since we use both natural and synthetic fibers in production, water and land usage are key factors that significantly contribute to our environmental impact. Freshwater Ecotoxicity (harmful effects of chemicals on freshwater organisms) & Eutrophication (nutrient buildup in water bodies that leads to excessive algae growth) are also included to measure effects on ecosystems and biodiversity.
Feel free to read more about our key indicators below, and do not hesitate to reach out if you would like additional information on our sustainability efforts or specific environmental impact indicators. Data for all 16 impact indicators is available upon request. Contact us at [email protected].


